The Advanced Photon Source
a U.S. Department of Energy Office of Science User Facility

LaueGo

This package is designed to view spatially resolved orientation data, as well as spatially and energy resolved diffraction data produced at a micro-diffraction beamline. It is generally useful for processing and viewing x-ray data from a fixed area detector used with either white or monochromatic x-rays, especially where such information is spatially resolved. For a single sample, the 34ID-E station at the APS often generates datasets containing on the order of 100,000 spatially resolved Laue diffraction images that then need to be automatically indexed and the subsequent orientation information assembled into a useful picture describing the material being studied. The analysis software to accomplish this task consists of two main parts.

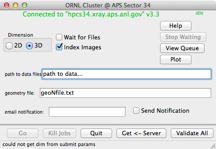
The first part is a small group of C programs that run on a local cluster (or a stand-alone PC) and are operated from a simple Python GUI. Additionally, the AES Software Services group developed a GPU-based implementation of the algorithm is available (see: SSG LaueGo documentation). These cluster programs can take a massive number of images and convert them into depth-resolved images, and then optionally index the resultant white beam images to provide the crystallographic orientation of each measured volume element.

The second part is a set of custom functions running in the Igor program for post-processing and viewing the results from the cluster. Although designed primarily for the 34ID-E micro-diffraction station, it has also been used as a stand-alone tool for orienting Laue patterns from a sealed tube source.


Distribution & Impact

This package is intended primarily for users of beamline 34ID-E, but has also been used to view and orient crystals on stand-alone Laue cameras. Code will be supplied upon request, but support is only provided for 34ID-E use. It requires Igor, a modestly priced scientific visualization/analysis program that operates on OS X and Windows (not Linux). It is currently the only supported approach for visualizing the complicated 1D, 2D, and 3D spatially resolved orientation data generated at 34ID-E. This package allows experimenters to easily examine the point-to-point crystallographic orientation found in most materials systems, and to investigate the spatial correlation of orientation, which is important for understanding materials properties. In addition to the crystallographic orientation, it can analyze energy resolved data to obtain the spatially resolved strain information that is another important part of a materials performance. The cluster programs are needed to process the sometimes-massive amounts of data produced at this station, where datasets may be as large as 6TB and are expected to grow in the future. The GPU-based implementation of the algorithm provides up to a four-fold speed-up as compared to a CPU-implementation.


Funding Source

This project was started by Oak Ridge National Laboratory and is currently maintained and improved using operational funding from the APS, contract DE-AC02-06CH11357.


Related Publications

Liu, W., Ice, G.E., Larson, B.C., Yang, W., Tischler, J.Z. and Budai, J.D. (2004). The three-dimensional X-ray crystal microscope: A new tool for materials characterization, Metall. Mater. Trans. A, 35(7), 1963–1967.

Liu, W., Zschack, P., Tischler, J., Ice, G.E. and Larson, B. (2011). X-ray Laue Diffraction Microscopy in 3D at the Advanced Photon Source, 10th International Conference on X-ray Microscopy, AIP, 1365, 108–111.


Future Work

Features and capabilities are continually being added as the need for them becomes apparent. While the programs running on the cluster are quite static, the capabilities of the Igor package are easily extensible. So optionally adding new capabilities is commonly done and quite simple.


Details.

The first 2 dimensions of the spatial resolution are easily obtained by scanning the sample across a focused spot of x-rays, to obtaining depth, the 3rd dimension, is harder. The general geometry for obtaining 3D volumetric data is to have a horizontal incident x-ray beam diffracting upward into an area detector. By taking images while an opaque knife-edge above the sample is scanned through the diffracted x-ray beams, we can calculate a diffracted patterns corresponding to the diffraction from each depth in the sample. This first computation, converting a sequence of images at different knife-edge positions into diffraction patterns at each individual depth is the depth sorting; this is the most computer intensive step in the process. Fortunately it only needs to be done once, and is only needed when taking 3D spatial data. This step is almost always done on a cluster, but can be done on a local PC. The subsequent indexing of the resultant set of depth resolved Laue patterns is also usually done on the cluster, and this process is controlled by a simple GUI. The image shows the first screen of the GUI from a python client that runs on a small PC and controls which images are depth-sorted and then indexed.The result of the indexing all of the images is written to an xml file that contains the indexation of each Laue pattern and the other information, particularly the (x,y,z) location of the volume element associated with the image. This process will reduce 380,000 images (2.3TB) to an xml file of only 1.8GB. This is the reason for using a cluster; reduce an unwieldy amount of data to one small manageable file.
This modest sized xml file is then transferred to the user’s computer where the Igor package can be used to view the intermediate results stored in the xml file.

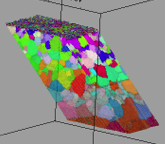
The image to the right shows a 3D volume showing the orientation produced from indexing 387582 spatially resolved white beam Laue images. The visible slab is 130µm thick and 210µm high. Each colored dot represent the measured orientation of a single volume element. The color scheme used for such a volume can be adjusted to display such parameters as strength of the Laue pattern, pole figure orientation, orientation about a specific axis, etc.

The Igor package can also be used to interactively index images, only a few images not thousands, to determine the indexing parameters to be used by the cluster or when only a few points are of interest.

In addition to this white beam analysis, the LaueGo package is also used to analyze energy scanned diffraction images (a sequence of monochromatic images). The depth-reconstruction step will be done for depth resolved data, and then the resultant energy and spatially resolved images can be histogramed into Q-space to determine a measured d-spacing (i.e. strain) or other diffraction properties for any measured reflection.

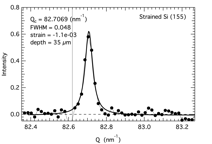
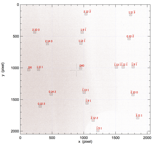
To the right is shown a measured histogram of |Q| from a Si (155) reflection at only one sample position and at a depth of 35µm below the sample surface. This type of Q-histogram may also be obtained for a spatial array of points to then display an image of the strain in the sample. Below is shown the Q-space scattering from only one volume element of KFeSe near the (0,0,20) reflection showing four satellite peaks. Here the intensity was histogrammed into a 3D vector Q space to show the location of the satellites.
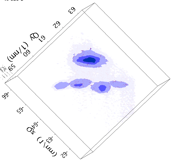