|
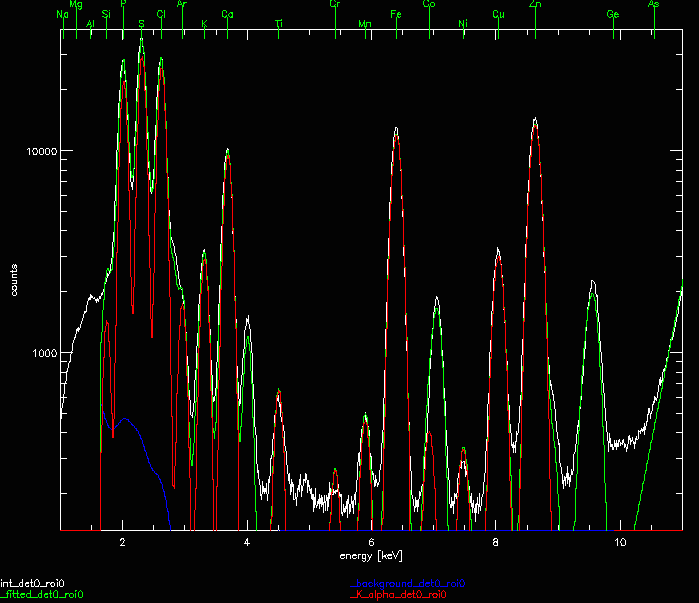
X-ray fluorescence (XRF) imaging typically involves the creation and analysis of 3D data sets, where at each scan position the full spectrum is recorded. This allows one to later process the data in a variety of different approaches, e.g., by spectral region of interest (ROIn) summation with or without background subtraction, principal component analysis, or fitting. Additionally, it is possible to sum up the per pixel spectra over selected spatial ROIs so as to improve the photon statistics in such a spectrum. MapsPy is a Python-based open source software package that implements these functions to provide a tool set for the analysis of 3D XRF data sets that is being developed to replace a very similar IDL-based tool called MAPS, which is currently in use.
Started in 2001 by Stefan Vogt, MAPS serves as the main analysis tool for XRF micro-probes at the APS. It features analysis methods for elemental maps, spectral, spectrum, and non-negative matrix data. It operates in batch mode, and also has an interactive GUI. The initial porting of MAPS to Python was done as part of an LDRD by Mirna Lerotic with assistance from Stefan Vogt. The MapsPy application is now being developed as a collaboration between the Software Services Group in the APS Engineering Services Division and the Microscopy Group in the X-Ray Science Division. In particular, Arthur Glowacki (SSG-AES), and Stefan Vogt and David Vine have been the main contributors. |
| Distribution & Impact |
|
MAPS is the main analysis tool for XRF microprobes in XSD (2-ID-B, 2-ID-D, 2-ID-E, 8-BM, 26-ID, 21-ID-D), as well as use at GSECARS. MapsPy code is available online at: https://github.com/MapsPy/MapsPy For information on the MAPS (IDL) code, see that project's home page. |
| Funding Source |
|
This project has been produced using operational funding from the APS, contract DE-AC02-06CH11357. The initial porting of MAPS to Python code was started with LDRD support. |
| Please cite |
|
S. Vogt (2003). MAPS: a set of software tools for analysis and visualization of 3D X-ray fluorescence data sets, J. Phys. IV. 635–638 doi: 10.1051/jp4:20030160 |
| MapsPy Development Plan |
|

